If I asked you to predict what areas of Brazil would be more affected by the Covid-19 contaminations, which city or state would you choose?
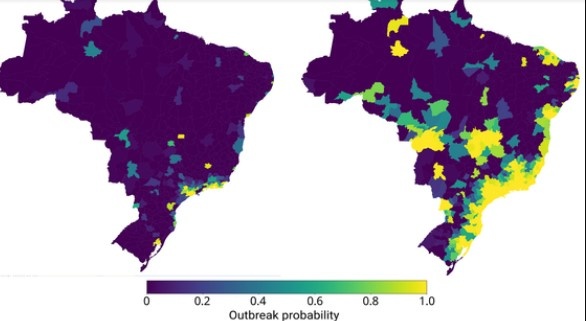
If you said São Paulo or Rio. You got it right. A study about the Covid-19 spread in Brazil made by a huge group of scientist (Coelho et al, 2020) came to the conclusion, very well predicted by Network theory, that in the absence of travel restrictions, the most likely micro-regions to develop an outbreak, besides São Paulo and Rio de Janeiro cities, are the geographic neighboring regions of these cities. After these epicenters, the other important urban and industrial centers such as Itajaí/Santa Catarina and Uberlândia/Minas Gerais have the second worst outbreaks probabilities, according to their models (Coelho and Lana, 2020).
Of course other variables, not considered in the research models, count for these results such as the lack of federal coordination, so well mentioned by Prof Deisy Ventura in her lectures, combined with the historic worst government the country has ever had.
However, thinking about the case of Sao Paulo and Rio, specifically, the variables that make these cities epicenters of past and present pandemics are clear from a sociological and network theory point of view : very populated cities, half of populations living in poor areas, with a lot of people sharing the same space, a huge number of international arrivals, the busiest roads and ports, big attractor of tourists, higher numbers of events such as concerts etc.
All these variables and the ones estimated in this study’s models corroborate the conclusion that an uncontrolled hotspot of COVID-19 in Sao Paulo produces a greater risk for earlier and widespread case exportation to all other cities and states.
So, Imagine we are looking at a map, in this map we have two yellow points representing
Rio and Sao Paulo contamination rates, as these rates grow with time, the yellow point gets bigger and bigger, the most immediate cities within these states also get yellow, the neighbour states get yellow, the most remote and less populated areas start to be covered, until pretty much all our map is completely yellow.
This imagination exercise is to illustrate one of the implications and conclusions this study arrived:
“ Knowing in advance which regions could potentially suffer the biggest hit first might have allowed authorities to opt for preemptive differential investments to the public health care system (SUS) in these regions. Unfortunately, the initial efforts by the government to allocate resources in a rational way was not timely and scientific enough “ (Coelho et al, 2020) .
References:
Coelho et al. Assessing the spread of COVID-19 in Brazil: Mobility, morbidity and social vulnerability, 2020. https://journals.plos.org/plosone/article?id=10.1371/journal.pone.0238214
Laszlo Barabasi, Network science, Book, 2011